Contributed by Felipe Mejia Medina, Member of the IS4H Team and network of experts
The emergence of the covid-19 pandemic has shown the benefits that having the appropriate information and communication technologies, as well as the knowledge and training to use them, can have for public health and for individuals. However, in order to take advantage of the great potential that digital health has in the Americas region, and with the aim of leaving no one behind and thus reducing the digital divide, access to and adoption of various ICTs is essential.

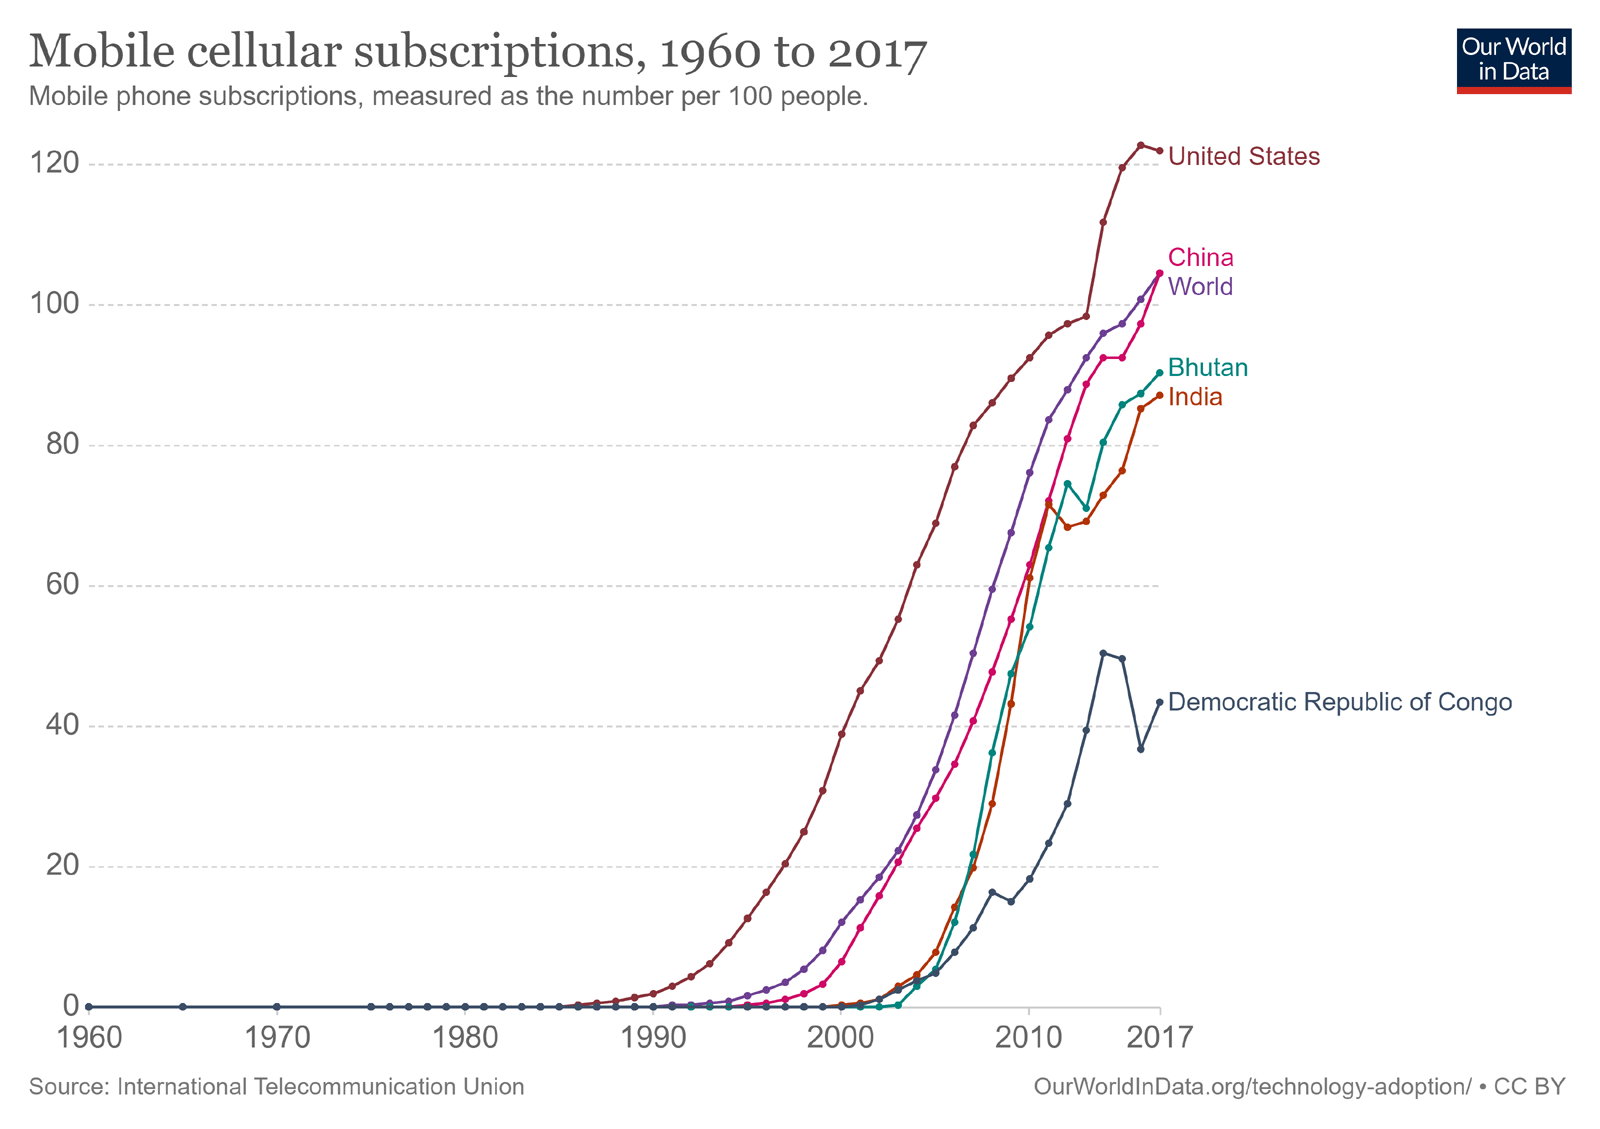
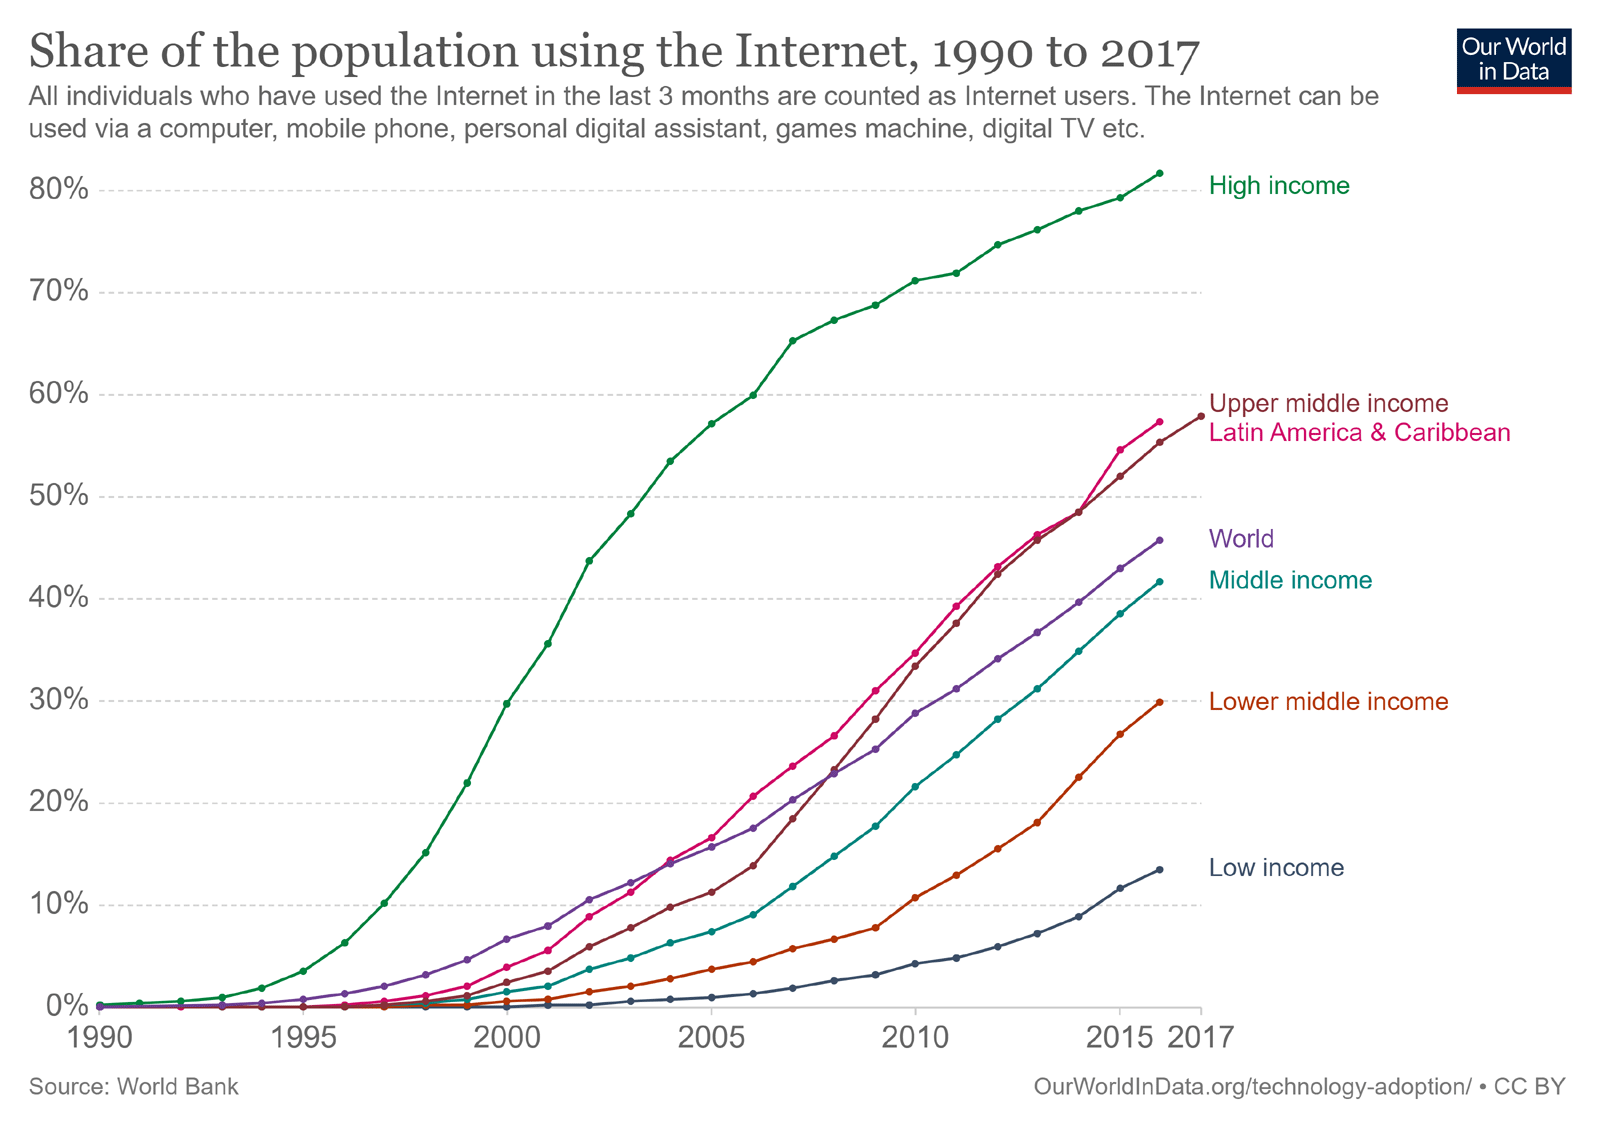
Figures 1i and 2ii show us how cell phone subscriptions and the percentage of the population using the Internet have changed, respectively. We observe that there are great differences. Despite the world average being 105 cell phone subscriptions for every 100 people, high-income countries report 125 for every 100 people, while low-income countries report 62. It should be noted that Latin America and the Caribbean is just over the world average with 107 cell phone subscriptions for every 100 people. In comparison, we see that the world average of people using the internet is 46%, with a huge difference between high-income countries, with 82%, and low-income countries, with 14%. As a reference, we see Latin America and the Caribbean with 58%. This tells us that, in order to leave no one behind, it is crucial to bridge that technological and digital gap between high-income and low-income countries.

We could then ask ourselves; how long would it take to close that gap? This is difficult to answer because it depends largely on the particular situation of each region, but we can take as a reference the times of adoption of other technologies that, at the time, have been key in the fight against economic inequality and inequities in Health.
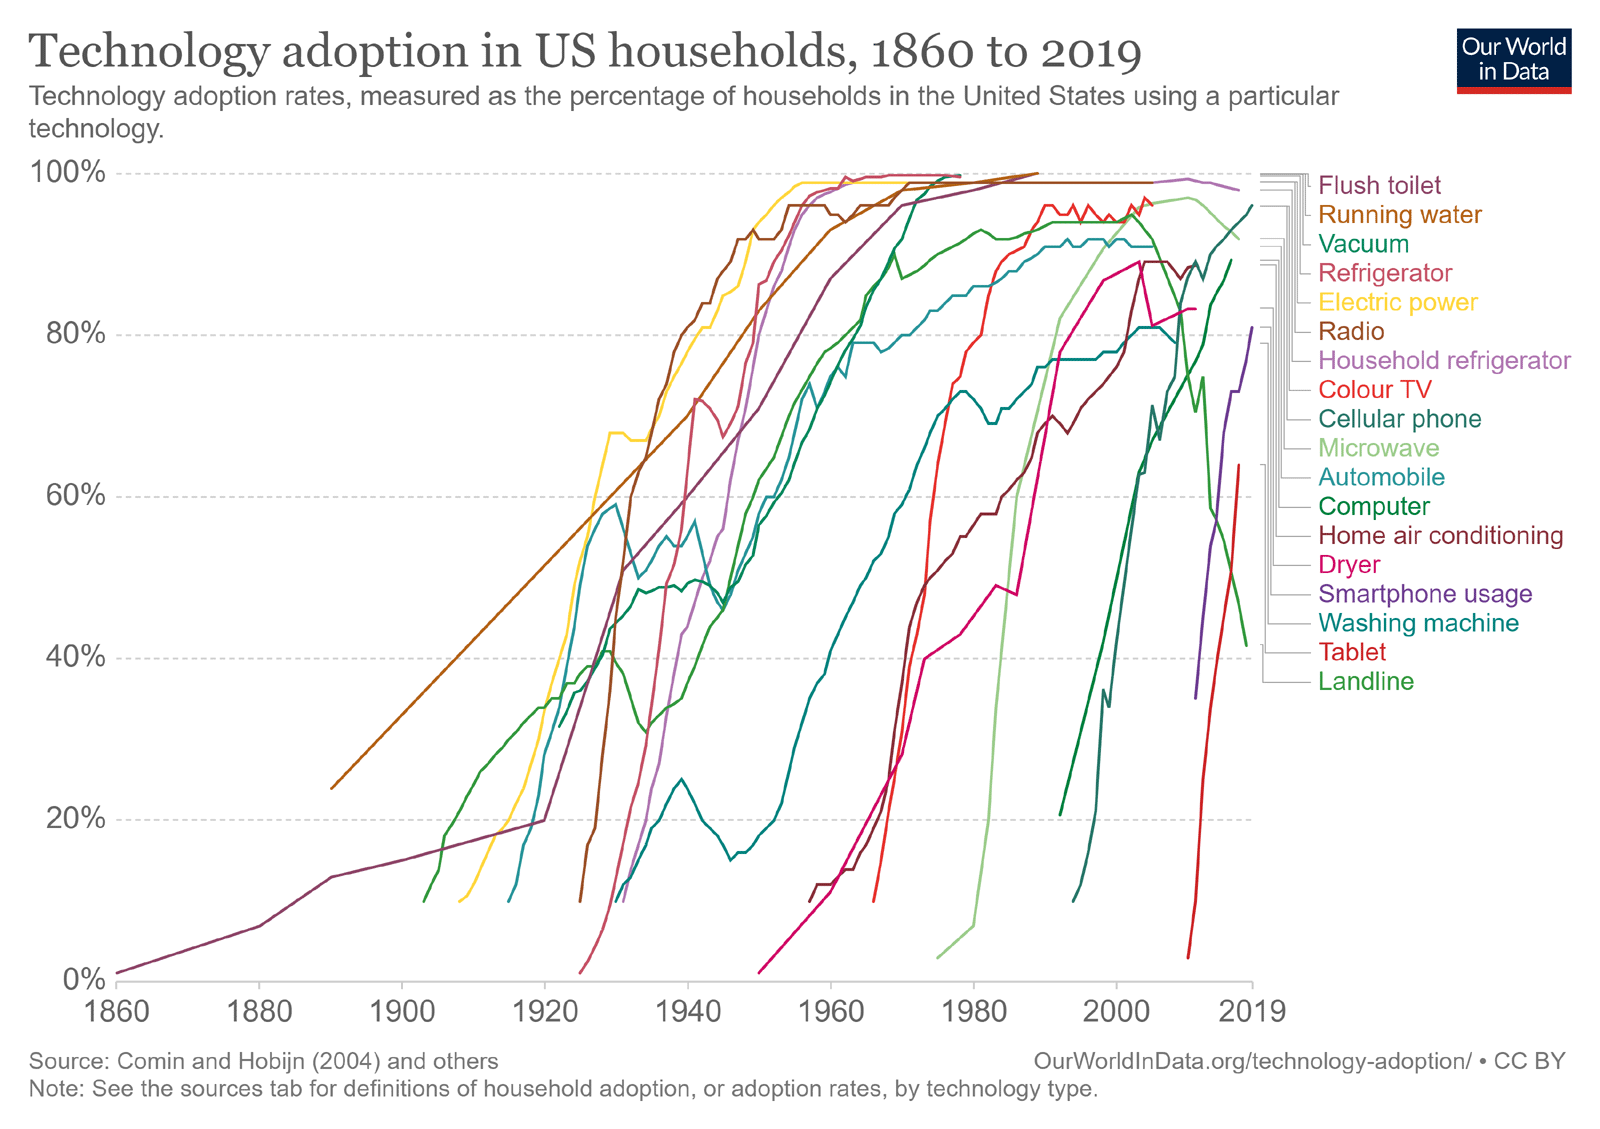
Figure 3iii shows us, for the United States, the adoption of various technologies between 1860 and 2019.

We see that it was required:
- 129 years for the toilet to reach 100% of households in 1989.
- 120 years for drinking water to reach 100% of households in 1980.
- 99 years for fixed telephony to reach its highest peak of 95% in 2002.
- 78 years for the automobile to reach its highest peak of 92% in 1993.
- 48 years for electricity to reach 100% of households in 1956.
- 47 years for the radio and the refrigerator to reach 100% of homes in 1971.
- 25 years for the cell phone to go from 10% to 96% adoption in 2019.
- 24 years for the computer to go from 20% to 89% adoption in 2016.
- 23 years for the internet to go from 10% to 88% adoption in 2016.
- 14 years for social media to reach 80% adoption in 2017.
- 7 years for the tablet to reach 64% adoption in 2017.
The foregoing shows us that the time required for a majority adoption of technologies has been shortened over time. At least as far as the United States is concerned, but presumably there should be a similar behavior, perhaps not with the same level of acceleration, in the rest of the world.
This suggests that bridging the current digital divide, in terms of access to the latest ICTs, should take significantly less time than was required for, for example, radio or electricity.
This, of course, depends largely on the particular social, political, economic and cultural circumstances of each country and region.
i Hannah Ritchie (2017) - "Technology Adoption". Published online at OurWorldInData.org. Retrieved from: 'https://ourworldindata.org/technology-adoption' [Online Resource]
ii Ibid.
iii Ibid.
